2. Work Market
Posted: April 11, 2016; Updated: April 12, 2016
In this project, the jobs in New York were analyzed for various parameters such as agency, job posting duration, job requirements and salary. The data was first analyzed assuming that each repeated position was a newly created position. In the second round of analysis, uniqueness criteria was applied where the assumption was that the repeated position was the same as previous position that remained unfilled. This is an ongoing work and the analysis of parameters 'Job Description', 'Minimum Qual Requirements', 'Preferred Skills', 'Additional Information' remains to be explored.
Note: To view the enlarged figures please right click on the image to click 'View Image'.
Source of Data:
Data file in .csv format was downloaded from NYC Open Data.
Questions asked:
- Find out which agencies have highest number of job openings.
- Find out which positions have highest and lowest salaries.
- Are there any jobs that take too long to fill, if yes which one.
- Is there any effect of residency requirement on filling a job.
- Is there any effect of level of a job on salary.
Possible answers:
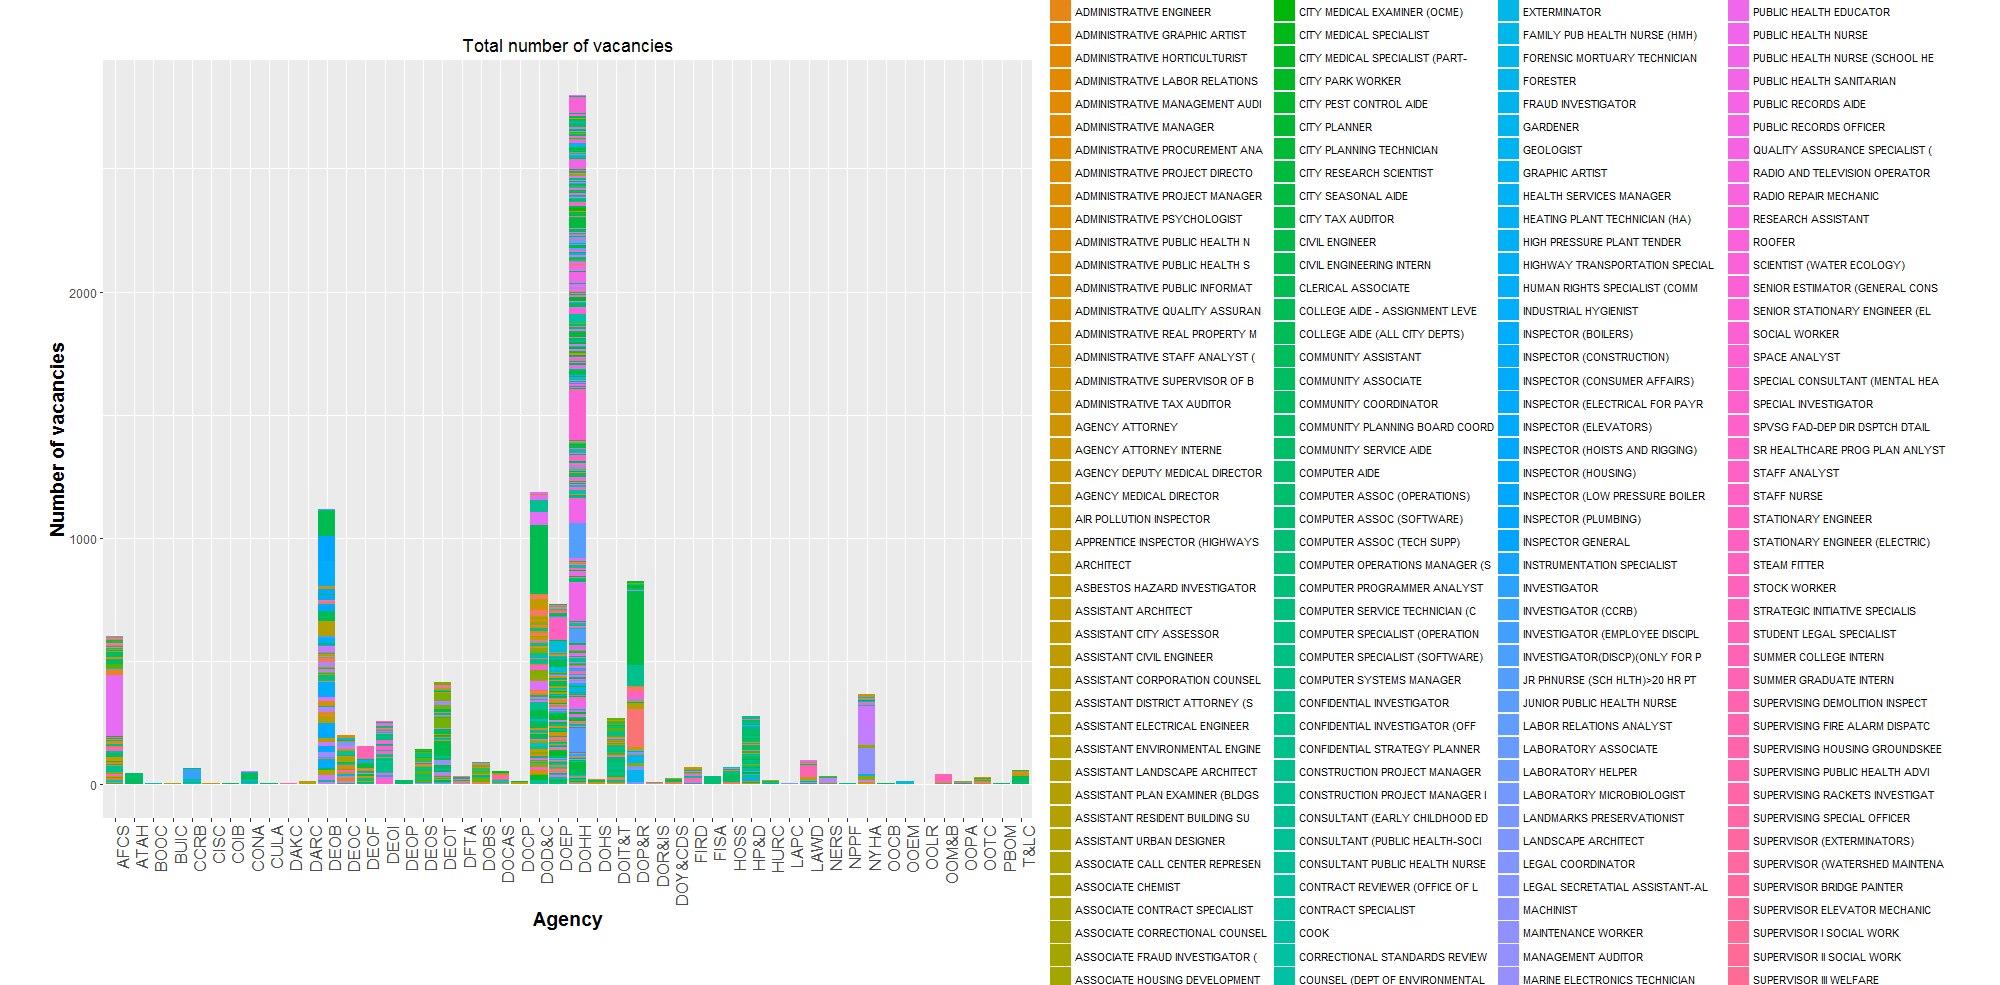
- The Department of Health/Mental Hygiene (DOHH) has the highest number of open positions (Figure 1).
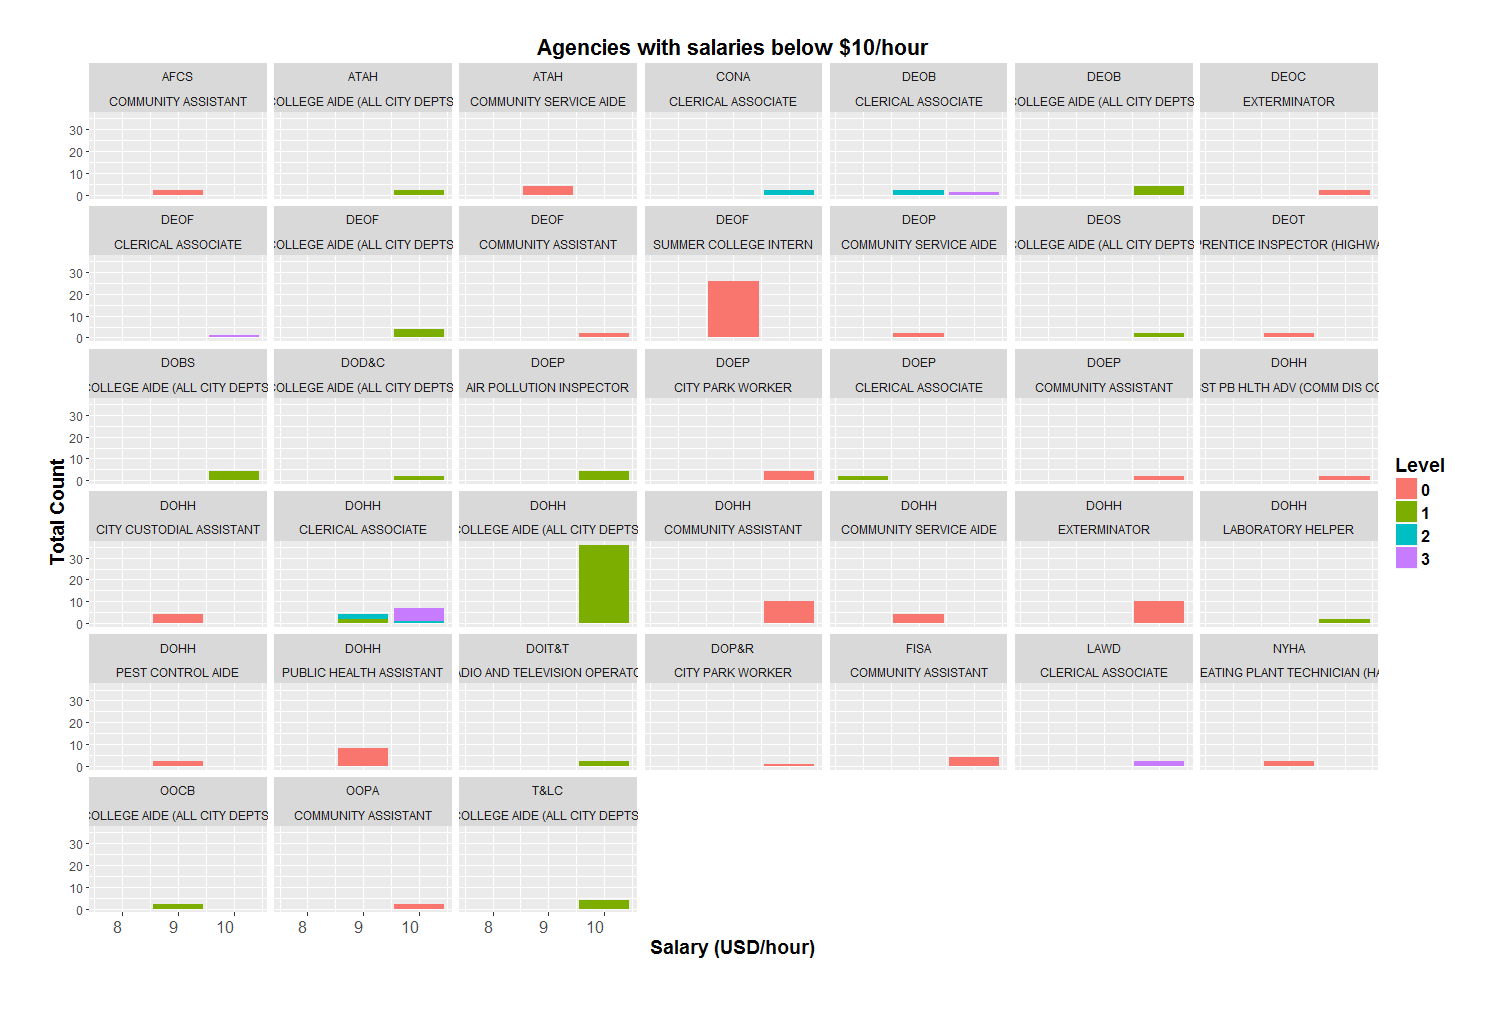
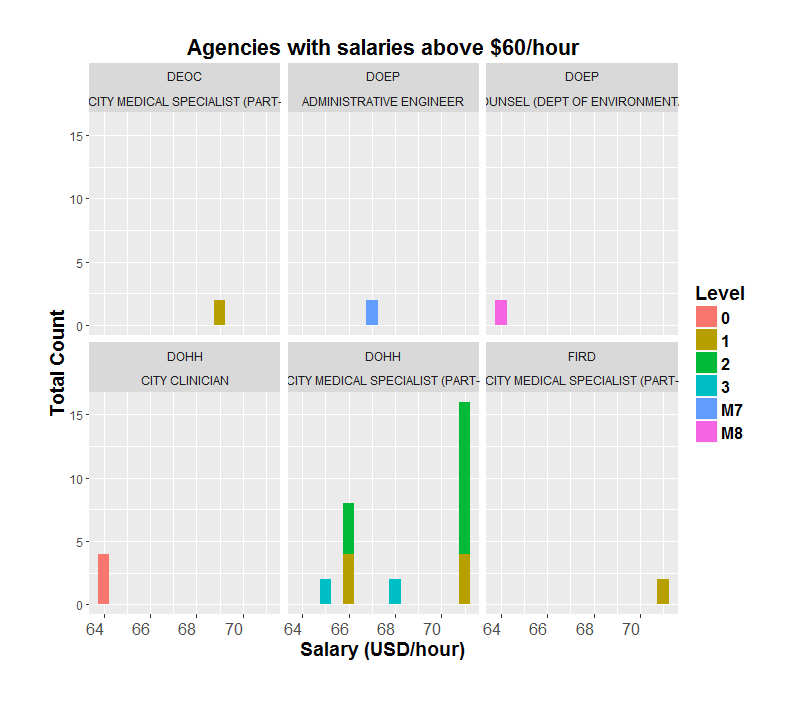
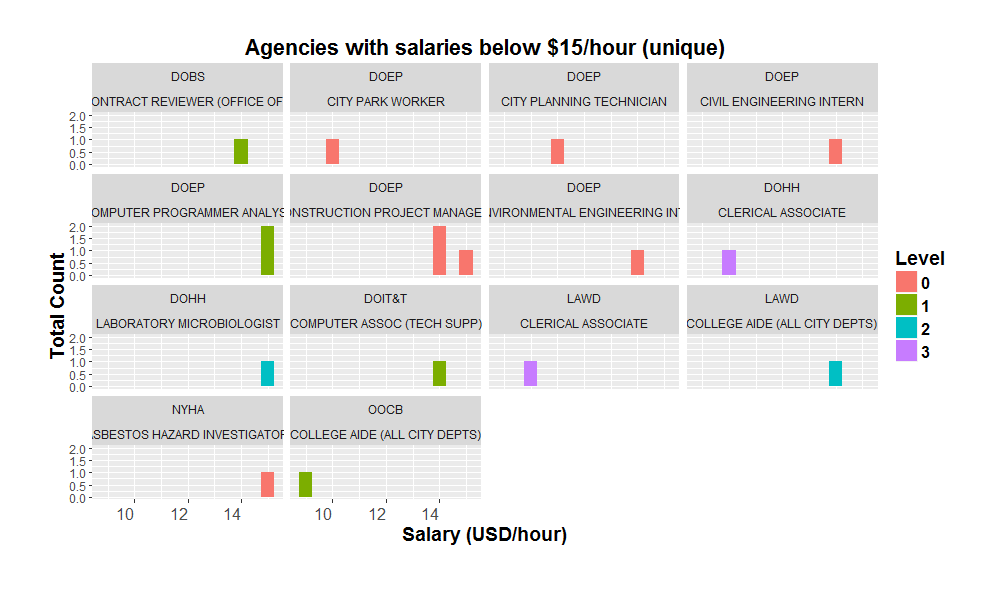
- The Department for Environmental Protection (DOEP) has the lowest salary of USD 8 per hour for the position of Clerical Associate (Figure 4). Whereas, Fire Department has the highest salary of USD 78 per hour for the position of City Medical Specialist (Figure 5).
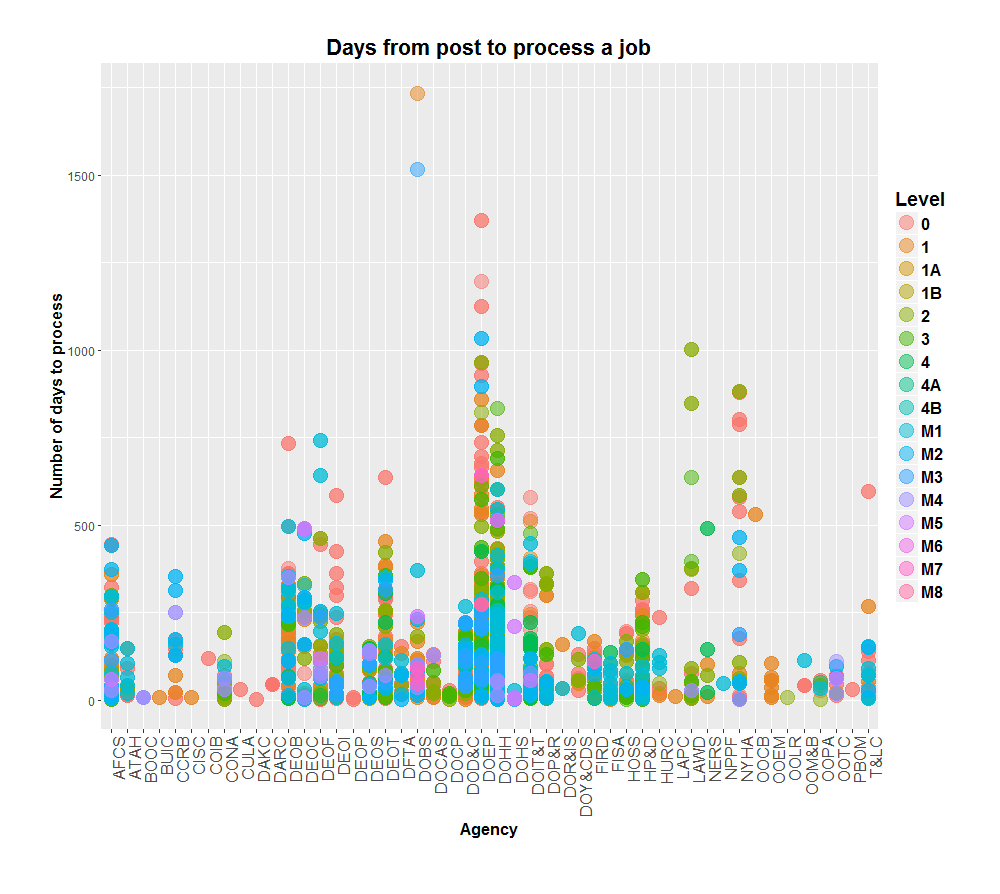
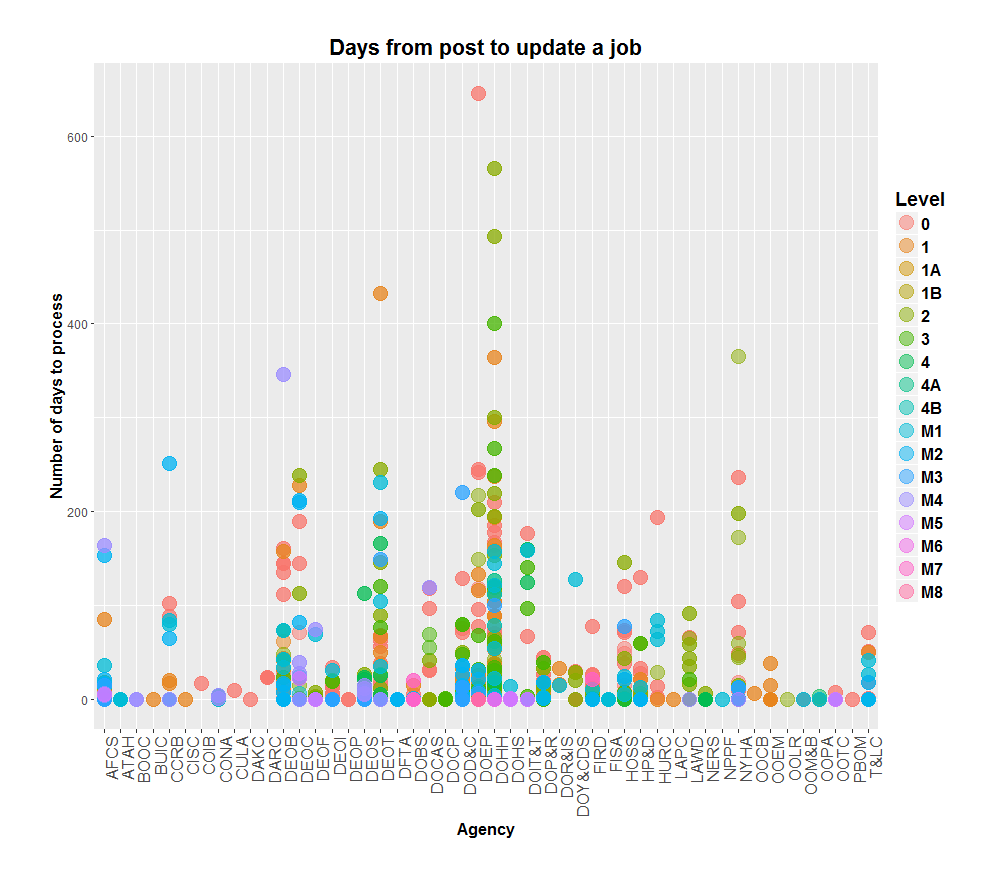
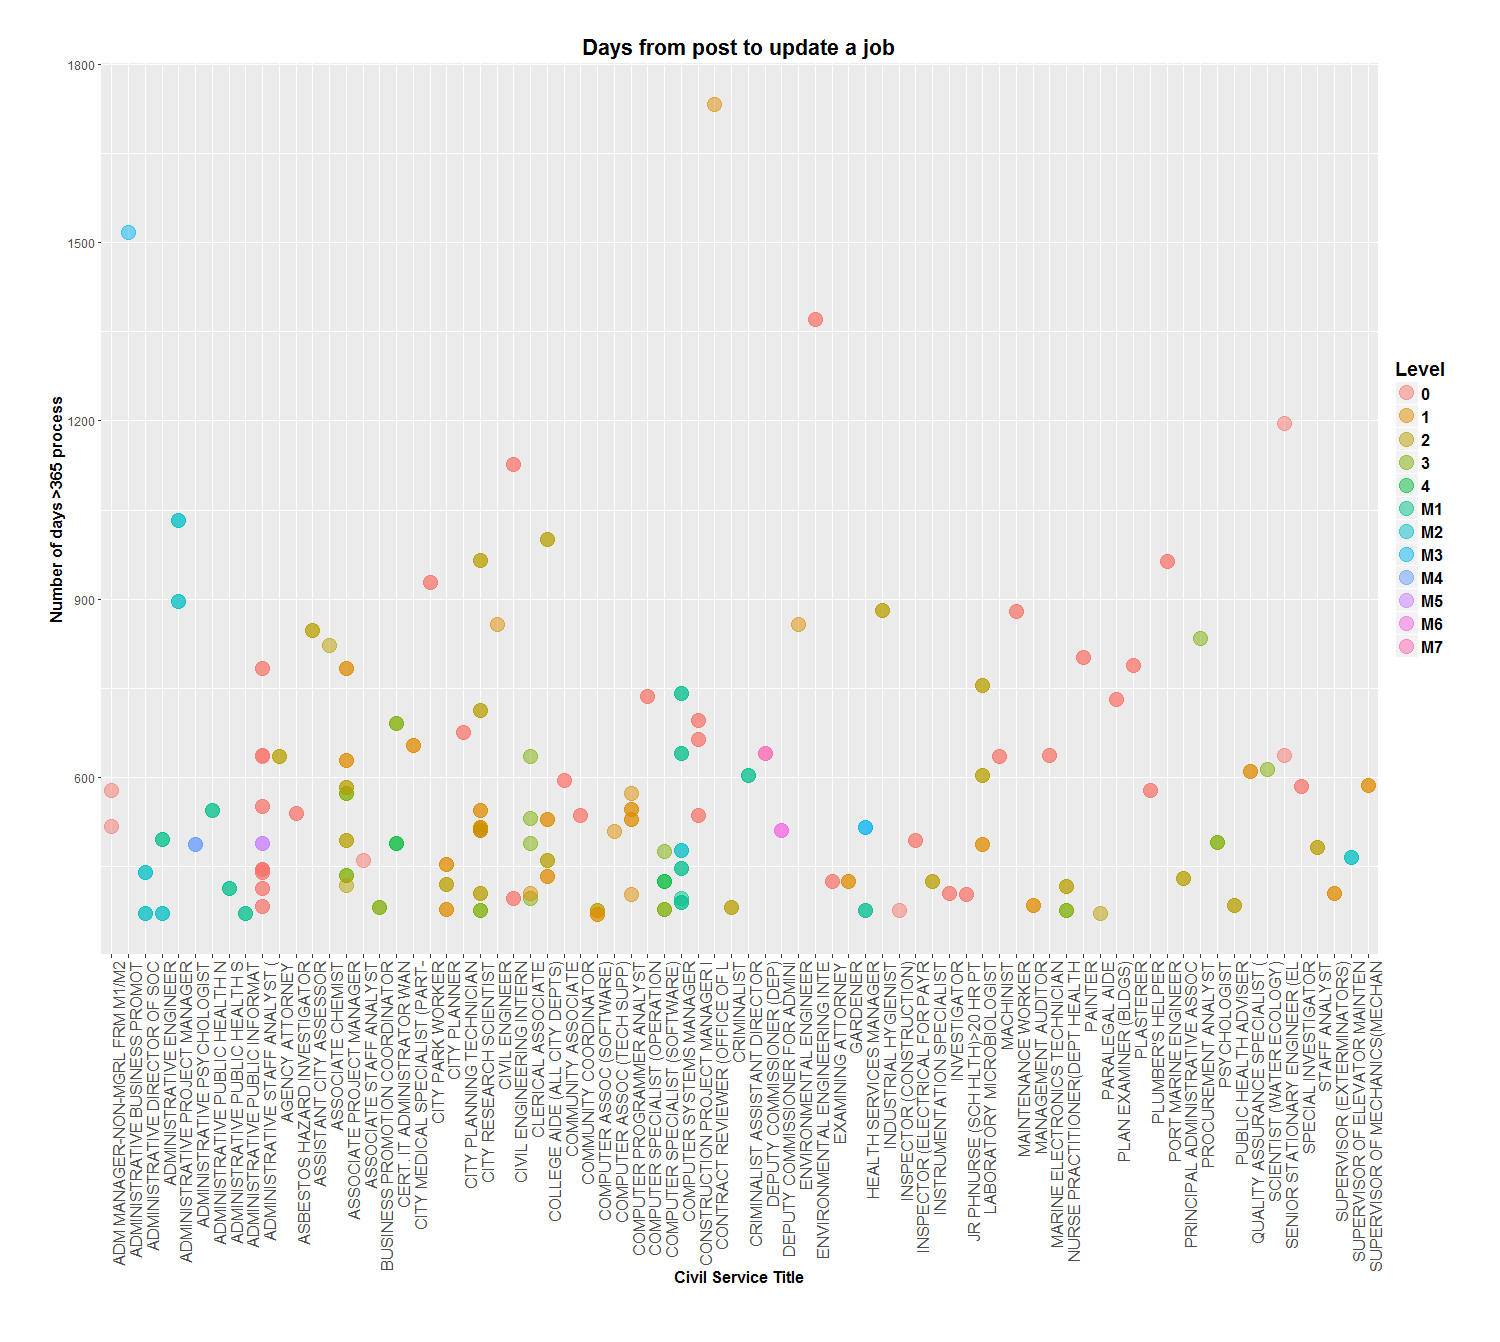
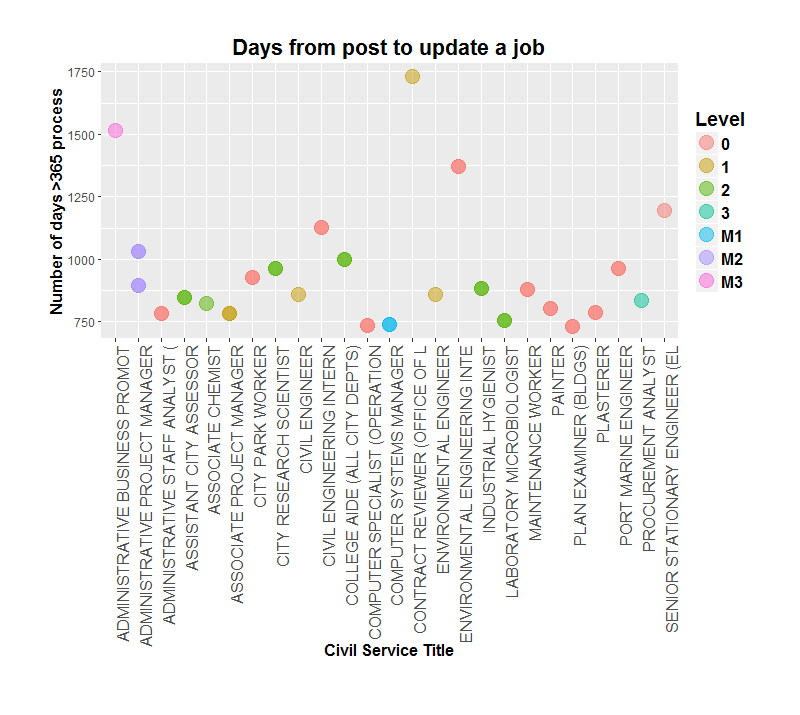
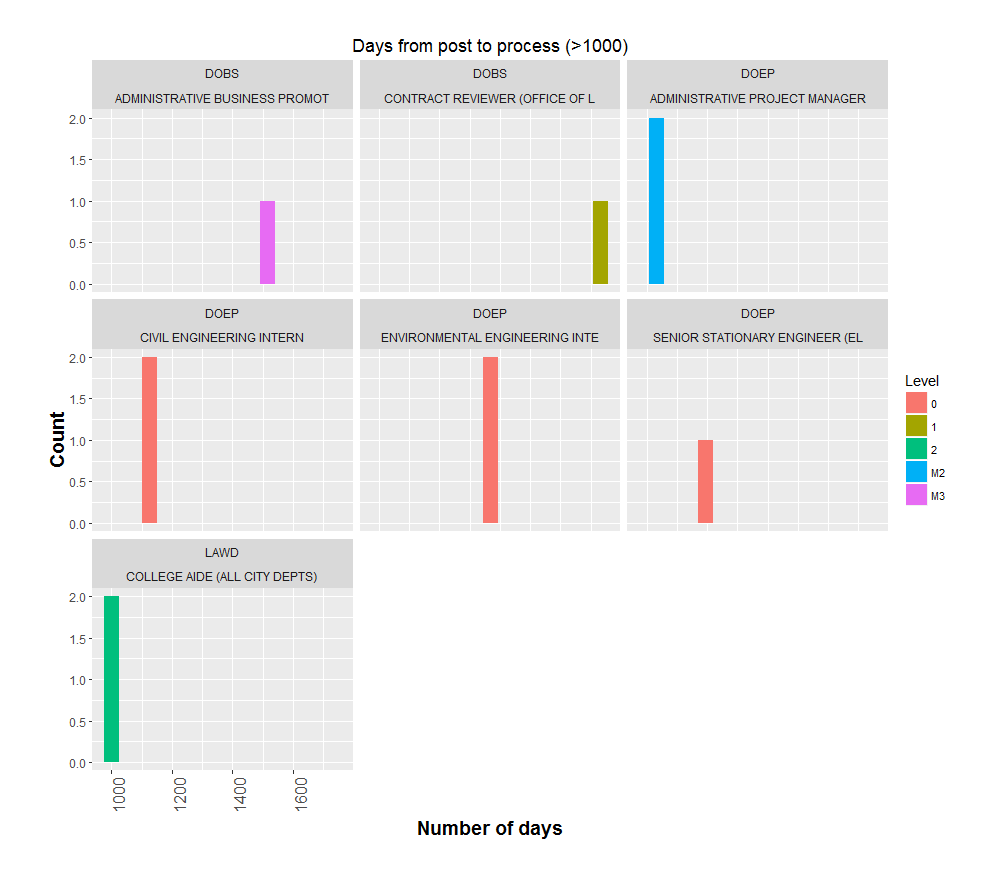
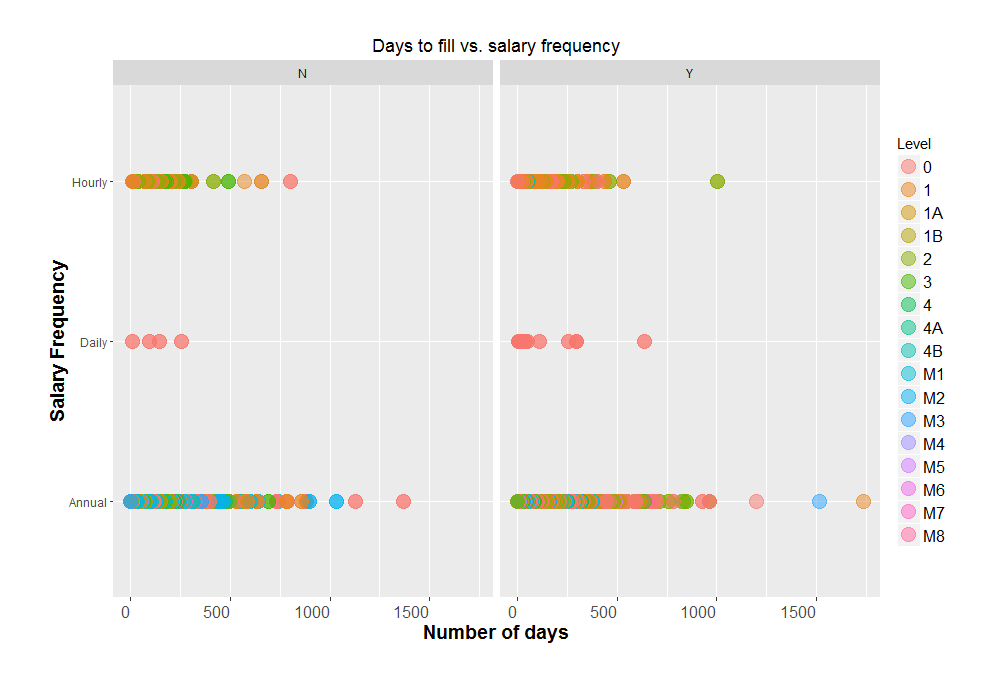
- Yes, there are positions that take more than 1000 days to fill/process. The toughest position to fill appears to be Contract Reviewer with Department of Business Services (DOBS) that may exceed 1700 days or 4.7 years (Figures 6 to 9 and 11)
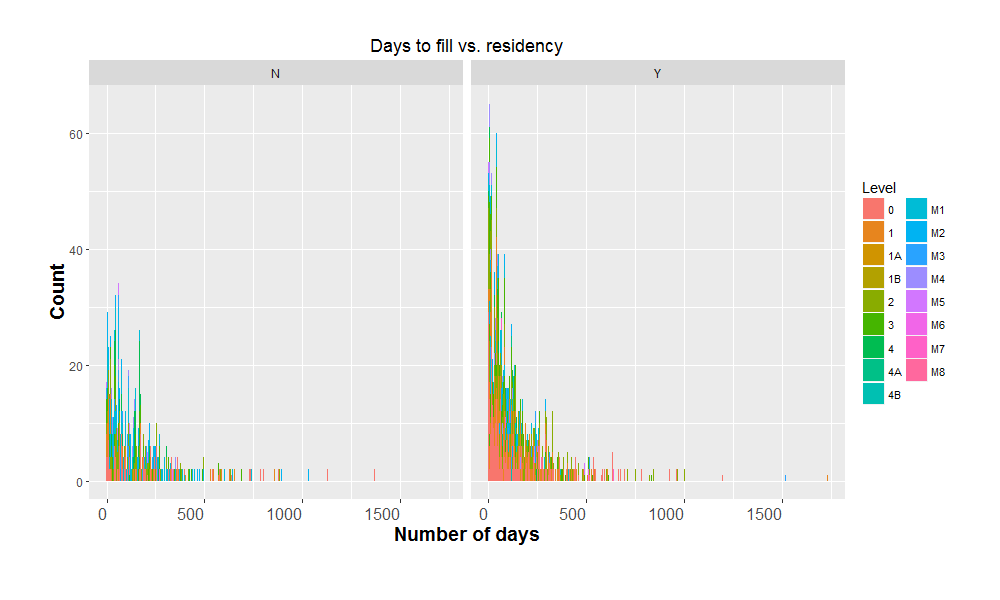
- Residency requirements appears to have little effect on the number days required to fill a job (Figure 13).
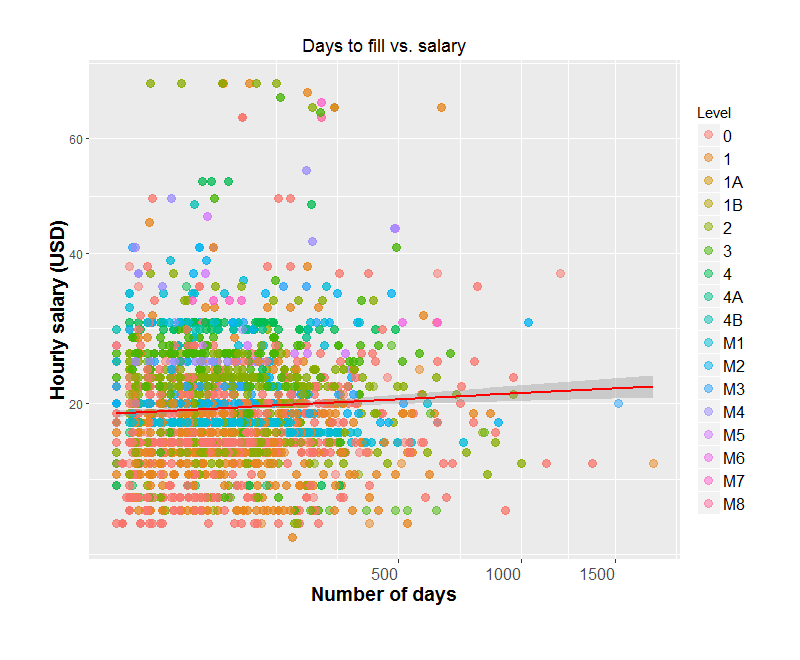
- There appears to be no direct relationship between salary and number of days required to fill the job (Figure 14)
Sample code:
# Abbreviating agency names
  jobs$agency.abr <- abbreviate(jobs$Agency)
# Function to convert annual and monthly salary to hourly salary
salconvert <- function(sal, salfreq){
  salfreq <- as.character(salfreq)
  if (salfreq == "Annual"){
    #print(Salary.Range.From/(365*8))
    return (sal/(365*8))  #convert annual pay to hourly rate 8 h/day
  }else if (salfreq == "Monthly"){
    return (sal/(30*8))
  }else if (salfreq == "Hourly"){
    return (sal)
  } else{
    return ("NULL")
  }
}
# sample code for plot
  ggplot(jobs)+
  aes(x=post.to.process, y = Salary.Frequency)+
  geom_point(size = 5, alpha = 0.5,aes(color=Level))+
  facet_wrap(~Residency)+
  xlab ("Number of days") +
  ylab ("Salary Frequency")+
  ggtitle ("Days to fill vs. salary frequency")+
  theme(axis.text.x = element_text(size = 12, angle=0, vjust=1, hjust = 1),
        axis.title=element_text(size=14,face="bold"),
        legend.text = element_text(size = 12),
        plot.margin=unit(c(1,1,1.5,1.2),"cm"))+
  guides(fill=guide_legend(ncol=2))
Figure gallery: